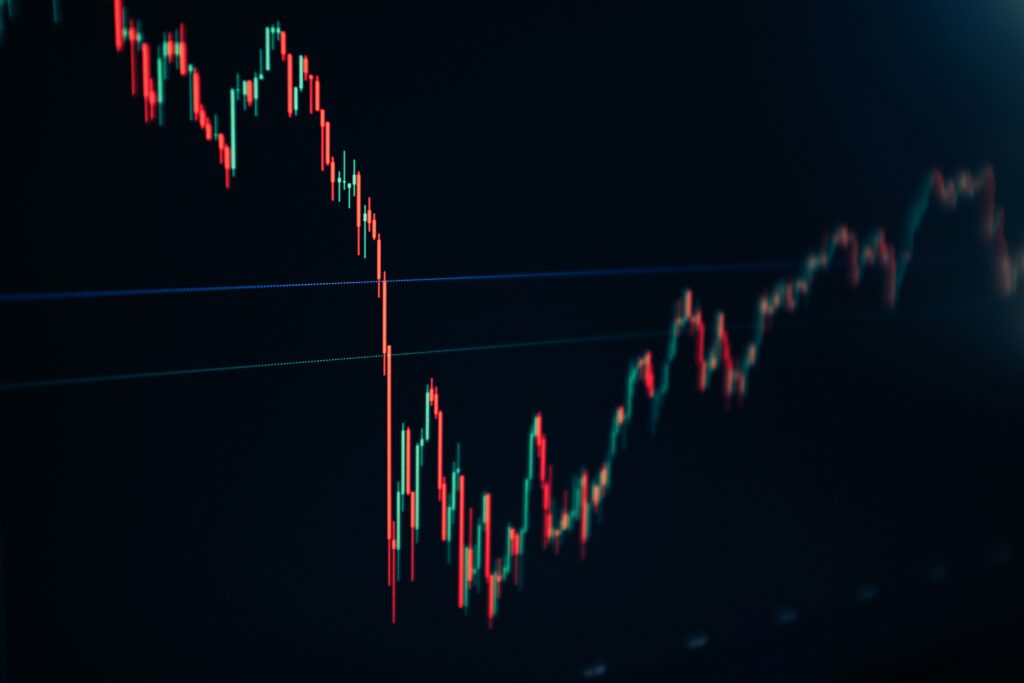
Financial markets are often thought of as rational systems driven by data, earnings, and economic indicators. However, the reality is quite different. Emotions are a major factor in the markets, influencing investors to buy or sell assets. No fundamental or rational thinking will help if investors are in panic and sell the asset in a hurry to limit losses. When prices rise quickly, inventors often become euphoric, and they rush to buy. When markets fall, fear spreads just as fast, pushing investors to sell at the worst possible price.
Fear during downturns and greed during rallies shape market behavior for decades. To capture these sentiment changes, analysts created tools that attempt to measure investor psychology. One of the most widely referenced is the Fear & Freed Index, which we will break down below, along with some practical tips.
What the Fear & Greed Index measures
When analysts explain what the Fear and Greed Index tells traders, they usually start with its core idea: markets usually move between two emotional extremes. The index attempts to calculate and measure whether investors are acting out of fear or out of greed at any given moment. The index combines several indicators that reflect investor behavior and market momentum. To understand what the index is, we need to understand and break down its constituent indicators.
- Stock price momentum
This indicator compares major indexes like the S&P 500 to their historical average. Strong upward momentum indicates increased optimism, while downward momentum is a sign of fear.
- Market volatility
Measures such as the VIX index track expected volatility. Spike indicates rising fear among investors. The VIX is a volatility index derived from S&P 500 options for the 30 days following the measurement date. If it declines, it is more of a sign of a greedy market.
- Market breadth
This observes how many stocks are rising versus falling. If many stocks are rising and few are falling, it can signal confidence, and the opposite is true if the majority of stocks are losing value.
- Safe-haven demand
When investors move their capital out of stock markets into bonds, gold, and other asset classes that are known as safe havens, it is a sign that the market might be in fear mode.
- Option activity
Heavy buying of protective options (puts) compared with bullish options (calls) signals growing concerns about market decline.
The final Fear & Greed Index readings
These indicators are combined into a single score that ranges between 0 and 100; it means the following:
- 0–24: Extreme Fear
- 25–49: Fear
- 50: Neutral
- 51–74: Greed
- 75–100: Extreme Greed
The core idea here is very straightforward: markets that are dominated by fear for a long time(near 0) might be undervalued, while markets driven by greed (above 75 and near 100) may be overbought. Surely, markets can go up for months even when the index shows extreme greed, meaning you should not take this index and use it as a single indicator for trading signals.
Why Market Psychology Matters
Investor psychology is a critical part of markets, and analyzing this behavior might be even more important than analyzing financial statements. If history has shown us anything, it is that market bubbles and crashes are often driven by emotions rather than pure fundamentals. During the famous dot-com bubble of the late 1990s, company valuations went far beyond realistic expectations. Many investors only bought because markets continued to rise indefinitely.
The complete opposite occurred during the 2008 financial crisis. Panic selling crashed stock prices quickly, even for companies that remained financially stable. This just shows how emotions overtake markets in such dramatic events, and fundamentals stop working for some time.
During uncertain situations, humans tend to follow crowd behavior during uncertain situations, a phenomenon which is known as herd mentality. In financial markets, this often leads investors to buy near peaks and sell near lows.
The Fear & Greed Index attempts to visualize these emotions in a simple way, which can help traders and investors measure market emotions before deciding on entries.
How to read and interpret the index
For beginner traders and investors, the index might feel super simple. However, interpreting it correctly requires understanding what it does and does not do.
- Extreme fear can signal a buy opportunity
When the index falls into extreme fear territory (0-24), markets are typically in the panic-selling mode. These periods usually coincide with market bottoms or recovery points. For example, during the COVID-19 market crash experienced in March 2020, the index fell into extreme fear territory as global markets collapsed. In the months that followed, stocks started one of the fastest recoveries in modern history. An important thing to remember is that not every fear reading leads to an immediate rally. But it often indicates that negative sentiment might end soon, and investors need to become very cautious and be alert not to miss a big rally.
- Extreme Greed Can Signal a Sell Opportunity
The opposite case is when extreme greed signals that markets are becoming too optimistic, and a crash or pullback might be near. When investors are too confident that prices will continue rising, they often ignore risks due to fear of missing out and greed. When investors become greedy, it leads to inflated valuations and speculative trading behavior.
A classic example occurred in late 2021, when tech stocks and cryptos surged. Sentiment indicators showed high levels of greed before the market correction occurred in 2022.
- Neutral Readings Reflect Balanced Markets
When the index is near 50 levels, markets are usually neutral and rational. Prices might be moving slowly and now dramatically. For long-term investors, neutral periods usually represent healthier market conditions.
How traders use it to time entries and exits – Practical Guide
So, how do professionals use the fear and greed index in their investing and trading? They rarely rely on a single indicator. As a result, the fear and greed index is often used alongside other analysis tools. Here are several practical use cases:
- Timing potential entries – Extreme readings can be used to spot possible buy or sell opportunities. “Be fearful when others are greedy, and greedy when others are fearful”.
- Identifying overextended markets – When fear or greed readings become extreme, traders should be cautious and seek exits from their current positions or investments.
- Confirmation of other signals – Combining sentiment indicators with technical analysis can be the most effective way to use this index profitably.
The index, therefore, works best as a supporting indicator rather than a standalone trading system. It can add context and confirmation to your current technical or fundamental trading/ investing system.